
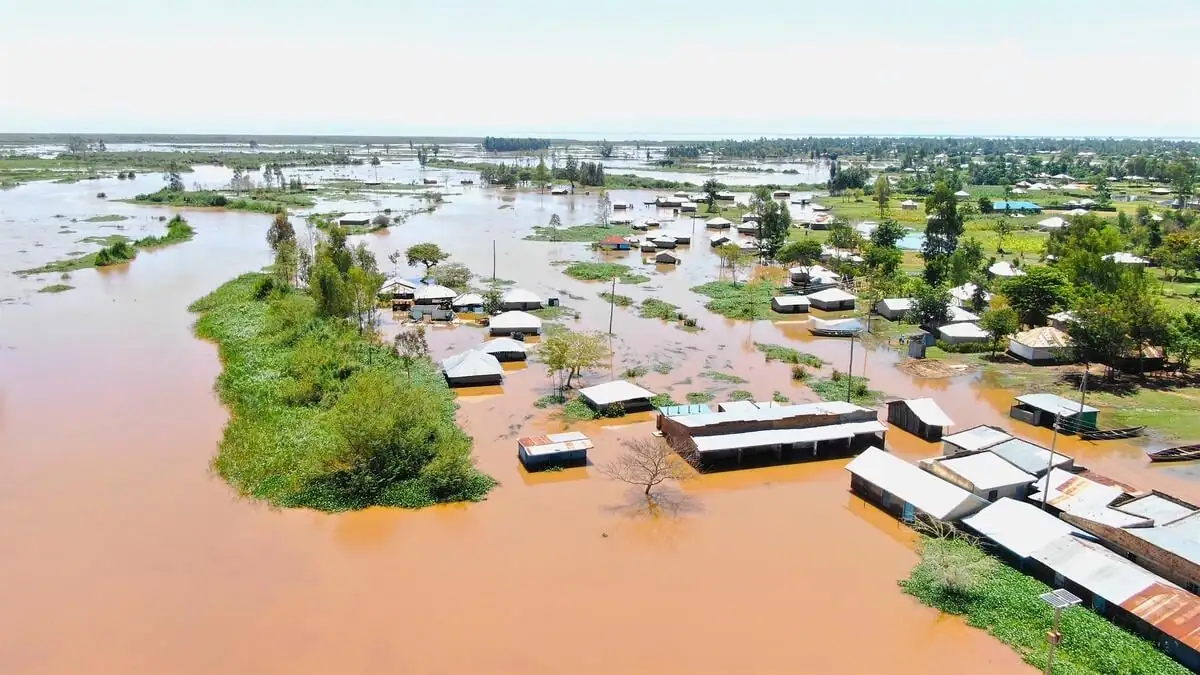
What the desk shows
Practical layers for the season, tied to farms Flygrow already serves in the field.
Rain and intensity
Station and model rain context, plus precipitation intensity cells for the selected county.
Surface water (SAR)
Sentinel-1 radar signal for elevated surface water, with farm buffer flags where relevant.
Crop stress (NDVI)
Satellite NDVI (Greenness) where boundaries exist, otherwise Farm Score leads the stress band.
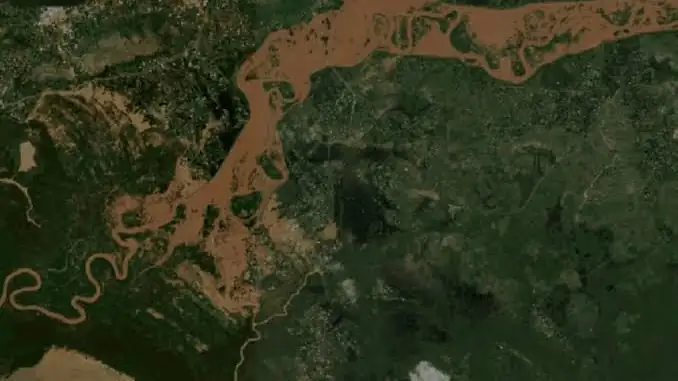
Space view of flood water in the landscape. The desk turns signals like this into county and farm priority, with source labels.
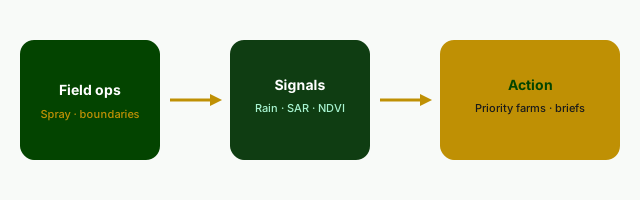
From field to priority list
Operations create ground truth. Weather and satellite add the wider picture. The desk ranks who needs a visit or a call first, so response is not guesswork.
Who it is for
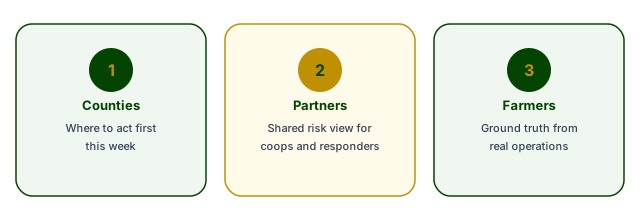
- County agriculture and disaster management units
- Humanitarian and recovery programmes
- Public interest and alert partners
- SACCOs, cooperatives and agri-insurers
Farmers stay central: free practical guidance where we operate. Institutions pay for the shared risk picture.
Data honesty
Stress bands prefer stored satellite NDVI (Greenness) when a farm has a boundary sample. Otherwise Farm Score leads. Rain, intensity and SAR water signals are labelled with sources. Official dam and river levels require partner feeds. We do not invent gauge readings or legal flood maps.
Ready to use the desk?
Sign in for the full county and farm view, or write to us for partner access and a short walkthrough.